07/21/2020 ML DATA 310 Responses
A
1.) How did you split the labels from the training set? What was the name of the labels datasets?
In our input function that returns tf.data.Dataset, the output is two-element tuples including features, and labels. Labels in this scenario are arrays containing the values of the label for every example. During the beginning phases of this model we split out the labels whic hthe model will be training to predict. We used the .pop function to remove the label column from the features. The name of the labels column was ‘Species’.
2.) List 5 different estimators from tf.estimator and include the base command as you would write it in a script.
- tf.estimator.DNNClassifier()
    - classifier = tf.estimator.DNNClassifier(
          feature_columns=my_feature_columns,
          hidden_units=[30, 10],
          n_classes=3)

 - tf.estimator.DNNLinearCombinedClassifier()

    - tf.estimator.DNNLinearCombinedClassifier(
          model_dir=None, linear_feature_columns=None, linear_optimizer='Ftrl',
          dnn_feature_columns=None, dnn_optimizer='Adagrad', dnn_hidden_units=None,
          dnn_activation_fn=tf.nn.relu, dnn_dropout=None, n_classes=2, weight_column=None,
          label_vocabulary=None, config=None, warm_start_from=None,
          loss_reduction=losses_utils.ReductionV2.SUM_OVER_BATCH_SIZE, batch_norm=False,
          linear_sparse_combiner='sum'
       )

 - tf.estimator.LinearClassifier()

    - tf.estimator.LinearClassifier(
          feature_columns, model_dir=None, n_classes=2, weight_column=None,
          label_vocabulary=None, optimizer='Ftrl', config=None, warm_start_from=None,
          loss_reduction=losses_utils.ReductionV2.SUM_OVER_BATCH_SIZE,
          sparse_combiner='sum'
        )

 - tf.estimator.BoostedTreesClassifier()

    - tf.estimator.BoostedTreesClassifier(
          feature_columns, n_batches_per_layer, model_dir=None, n_classes=2,
          weight_column=None, label_vocabulary=None, n_trees=100, max_depth=6,
          learning_rate=0.1, l1_regularization=0.0, l2_regularization=0.0,
          tree_complexity=0.0, min_node_weight=0.0, config=None, center_bias=False,
          pruning_mode='none', quantile_sketch_epsilon=0.01, train_in_memory=False
        )

 - tf.estimator.BinaryClassHead()

    - tf.estimator.BinaryClassHead(
          weight_column=None, thresholds=None, label_vocabulary=None,
          loss_reduction=losses_utils.ReductionV2.SUM_OVER_BATCH_SIZE, loss_fn=None,
          name=None
        )
### 3.) What is the purpose of input functions and feature columns?
#### An input functions is a function that returns a tensorflow dataset object whose outputs both features and labels. For example, in our premade estimator the input functions incorporates our features: sepal length, sepal width, petal length, and petal width. Feature columns are objects that describe how the model should use raw input data from the features dictionary. By building a list of feature columns, we are able to create a dictionary for our data to sit in to continue evaluating.
### 4.) Describe the command classifier.train() in detail. What is the classifier and how did you define it? What nested function are you applying to the training/testing datasets?
#### After we run our data throug the DNN-Classifier, we are then going to train the model. Within the training function itself we see a lambda function which will return the sum of two arguments. Lambda functions can also reference variables from the containing scope. Also in the classifier we see the step function, this tells the method to stop training after a number of training steps.
### 5.) Redefine your classifier using the DNNLinearCombinedClassifier() as well as the LinearClassifier(). Retrain your model and compare the results using the three different estimators you instatiated. Ranke the three estimators in terms of their performance.
#### First Place - LinearClassifier() = 0.957 “Setosa” (94.8%), expected = “Setosa” “Versicolor” (98.3%), expected = “Versicolor” “Virginica” (94.6%), expected = “Virginica”
#### Second Place - DNNClassifier() = 0.933 “Setosa” (84.7%), expected = “Setosa” “Versicolor” (42.5%), expected “Versicolor” “Virginica” (57.3%), expected “Virginica”
#### Third Place - DNNLinearCombinedClassifier() = 0.813 “Setosa” (74.3%), expected = “Setosa” “Versicolor” (43.3%), expected = “Versicolor” “Virginica” (59.7%), expected = “Virginica”
B
1.) Build a Linear Model
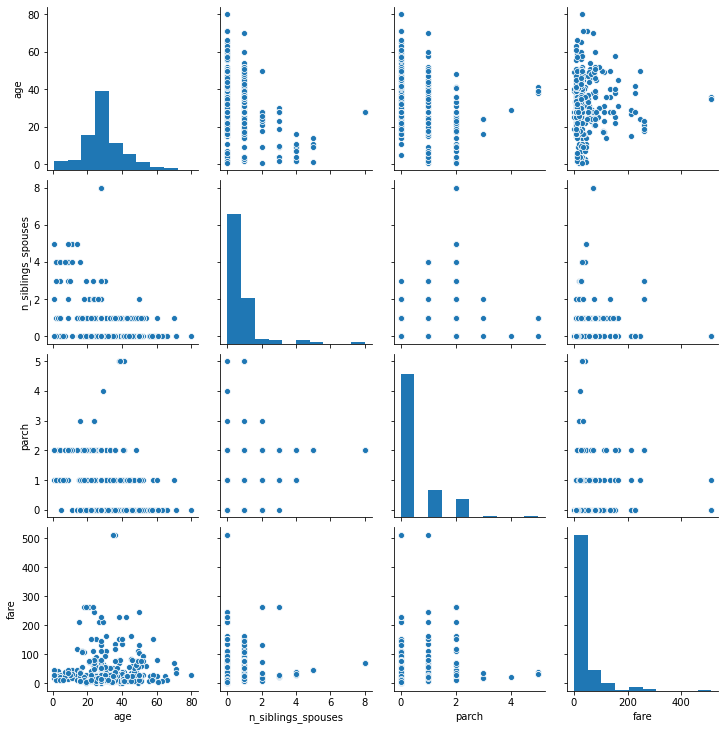
Seaborn Pairplot
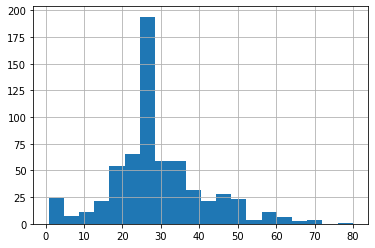
Age Histogram
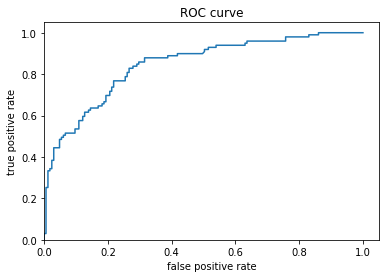
Titanic Curve
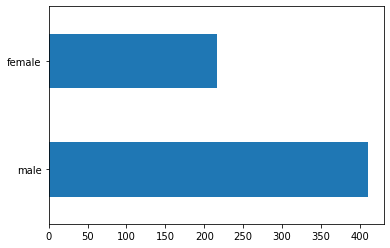
Titanic Bar Graph M/F
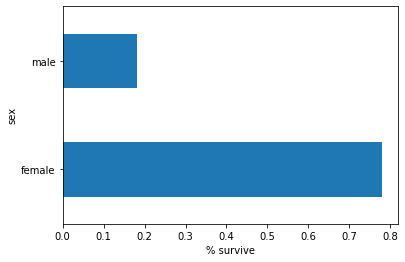
Titanic Bar Graph M/F Survival Percentage
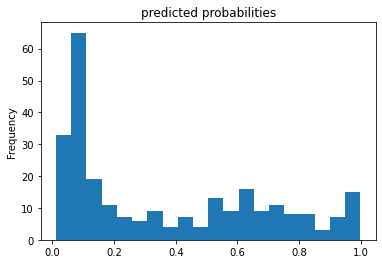
Titanic Predicted Probabilities
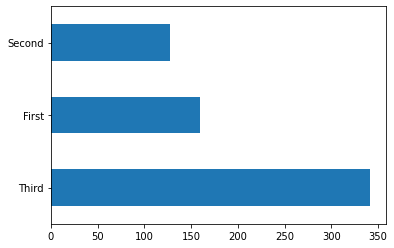
Titanic Class
